Tadawul REIT Disclosures: The Free Saudi Property Dataset
CMA rules force every Tadawul REIT to publish per-asset occupancy twice a year. 19 funds, 91.2% average occupancy in Q1 2026: the free dataset, decoded.
Saudi Arabia's Capital Market Authority requires every Tadawul REIT to publish the occupancy rate of each individual property it holds, twice a year, and its portfolio revalued by two independent valuers every six months (CMA Real Estate Investment Funds Regulations, 24 Nov 2025). With 19 funds on the main market and one on Nomu (Argaam listing, July 2026), the filings are the largest free, audited, asset-level property dataset in the Kingdom: occupancy, rents, tenants, lease expiries, valuations. Average occupancy across their own disclosures: 91.2% in Q1 2026, down from 92.1% a year earlier (Argaam survey). Almost nobody reads these documents. We do.
Key figures at a glance
| Metric | Value | Scope | As of | Source |
|---|---|---|---|---|
| Traded REIT funds | 19 main market + 1 Nomu | Tadawul | Jul 2026 | Argaam |
| Per-property occupancy disclosure | mandatory, semi-annual | every listed REIT | in force 24 Nov 2025 | CMA, Annex 5 |
| Independent valuations | 2 valuers, every 6 months, published within 15 days | every listed REIT | in force 24 Nov 2025 | CMA, Art. 37(c) |
| Minimum profit distribution | 90% of net profits annually | every REIT | in force 24 Nov 2025 | CMA, Art. 47(b) |
| Sector average occupancy | 91.2% (vs 92.1% Q1 2025) | all listed REITs | Q1 2026 | Argaam survey |
| Riyad REIT portfolio occupancy | 98%, on 799,463 sqm NLA | largest listed fund | Dec 2025 | Riyad REIT AR 2025 |
| Sector cash distributions | ~SAR 464 million | all listed REITs | H1 2024 | Argaam |
What CMA regulations make every Tadawul REIT publish
The Real Estate Investment Funds Regulations of 24 November 2025 hard-code the whole regime in one 94-page PDF on the CMA's site. It is the closest thing Saudi real estate has to a freedom-of-information act.
The core rule is Annex 5: twice a year, each fund must list every property, its share of total assets, and "the occupancy percentage for each property as at the end of the relevant half." Asset-level, not a blendable portfolio average.
Around it sit five further obligations:
- Quarterly statements within 10 days of quarter-end (Art. 26(a)).
- Two accredited valuers at least every six months, published within 15 days and stating "the rental market value of the relevant real estate" (Art. 37(c)).
- A 10-year revenue history and each asset's share of total fund rent in every annual report (Annex 4).
- Any purchase, sale, lease or mortgage worth 10% or more of NAV disclosed "without any delay" (Art. 50(B)(1)).
- At least 75% of total assets in developed, rental-income-generating real estate (Art. 47(b)(1)), and at least 90% of net profits distributed annually (Art. 47(b)(2)).
Which REITs trade on Tadawul?
Nineteen funds trade on the Tadawul main market under tickers 4330 to 4350 (4341 and 4343 are retired), plus Alwaha REIT on Nomu under 9300: 20 traded funds (Argaam sector listing, July 2026; Nomu).
| Ticker | Fund | Ticker | Fund |
|---|---|---|---|
| 4330 | Riyad REIT | 4340 | Al Rajhi REIT |
| 4331 | Aljazira REIT | 4342 | Jadwa REIT Saudi |
| 4332 | Jadwa REIT Alharamain | 4344 | SEDCO Capital REIT |
| 4333 | Taleem REIT | 4345 | Alinma Retail REIT |
| 4334 | Al Maather REIT | 4346 | MEFIC REIT |
| 4335 | Musharaka REIT | 4347 | Bonyan REIT |
| 4336 | Mulkia REIT | 4348 | Alkhabeer REIT |
| 4337 | Al Aziziah REIT | 4349 | Alinma Hospitality REIT |
| 4338 | Alahli REIT 1 | 4350 | Alistithmar REIT |
| 4339 | Derayah REIT | 9300 | Alwaha REIT (Nomu) |
What the filings show, sector by sector
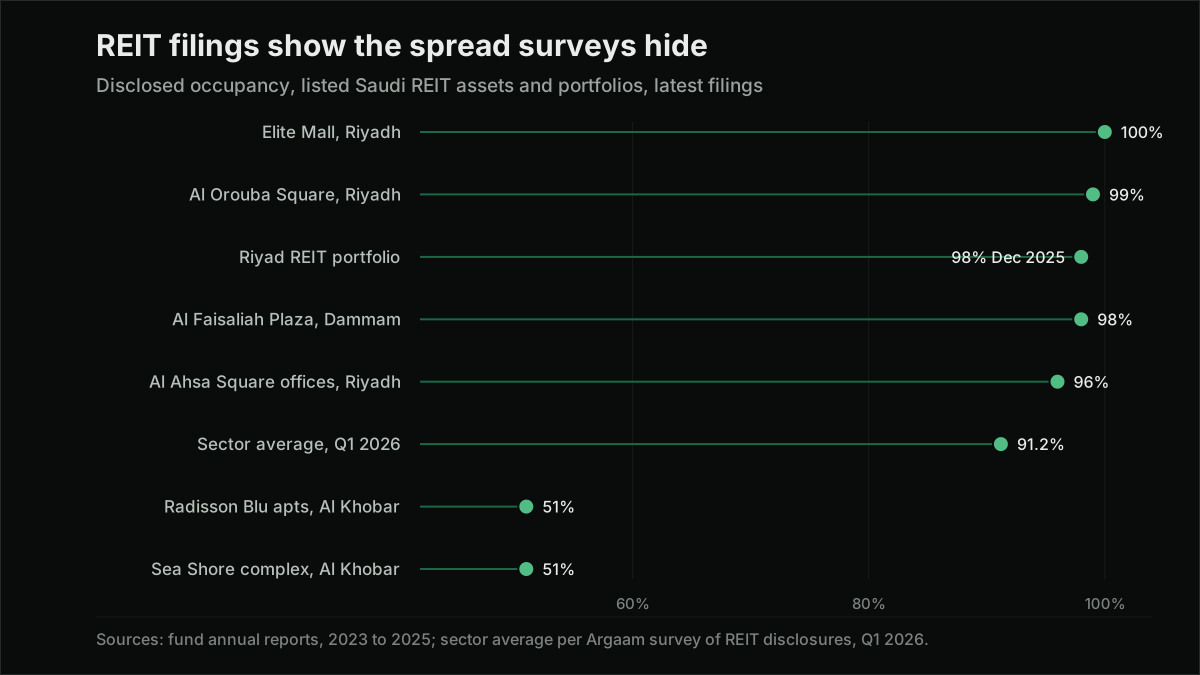
Four sectors, real assets, every figure from the funds' own filings. The spread is the story: Riyad REIT's Olaya Tower at 100% occupancy in December 2025, Musharaka's Al-Khobar hotel apartments at 51% across FY2024, and rent-and-area pairs between them that divide into implied rates nobody sells you.
Office. Riyad REIT's Olaya Tower runs at 100% occupancy on a 2.42-year weighted average unexpired lease term; its Al-Raed Building, also 100%, carries 21% of the fund's asset rent on one government tenant (Riyad REIT Annual Report 2025, Dec 2025). Al Rajhi REIT's Al Ahsa Square, a multi-tenant Riyadh office, discloses 96.04% occupancy on 9,162 sqm built-up, acquired for SAR 72,178,814, roughly SAR 7,878 per built sqm (Al Rajhi REIT Annual Report 2023, Dec 2023). Both anchor our Riyadh office market analysis.
Retail. Mulkia REIT's Elite Mall in Riyadh discloses SAR 16,000,000 annual rent on 21,929 sqm at 100% occupancy (Mulkia REIT Annual Report 2024, Dec 2024): about SAR 730 per sqm per year, and a gross rent yield near 8.3% on its SAR 193,831,500 average valuation. Musharaka REIT names tenants and expiries: Al Orouba Square in Riyadh, 99% let, SAR 8,138,725 net on 11,082 sqm leasable (≈SAR 734/sqm), Hyper Panda and Al-Baik anchored to 2036 (Musharaka REIT Annual Report 2024, FY2024). Private surveys never itemise anchor lease maturities; a public PDF just did.
Hospitality. Jadwa REIT Alharamain discloses hard Makkah capital costs: SAR 250 million in 2017 for the 690-room Tharawat Al-Taqwa Hotel, about SAR 362,000 per key some 900 m from Mina, against SAR 379 million for the 294-room Tharawat Al-Andaloseya within 500 m of Masjid Al-Haram, about SAR 1.29 million per key (Jadwa Investment). A 3.6x per-key spread inside one fund, pricing one variable: distance to the Haram. Jadwa publishes cost, not occupancy; the official occupancy backdrop is in our Makkah hotel market analysis. Outside the holy cities the trade is softer: Musharaka's Radisson Blu Hotel Apartments in Al-Khobar disclosed 51% occupancy on 92 units and SAR 9,145,958 annual income (Musharaka REIT, FY2024).
Logistics. Musharaka's Al Barakah Warehouses in Riyadh's Sulay district: 100% occupied, single tenant Damco on a five-year lease, SAR 6,600,000 annual income against an average valuation of SAR 91,454,000 (Musharaka REIT, FY2024). Divide one by the other: a disclosed net initial yield near 7.2% on Riyadh logistics, which no public body publishes.
How to build occupancy and rent proxies from the filings
The method is mechanical: 20 funds, every semi-annual per-property list, each asset tagged by city and sector. Done across the full set it yields dated series like the sector aggregate's slide to 91.2% in Q1 2026 from 92.1% a year earlier. It is the approach in our methodology, one layer of the wider stack of Saudi real-estate data sources.
Occupancy proxy: weight each asset by leasable area (see what counts as gross leasable area: funds mix GLA, built-up and land figures freely). Riyad REIT climbed from 94.1% in Q1 2024 to 98% by December 2025 (Argaam, Q1 2024; Riyad REIT AR 2025), while the sector-wide dip printed in Q1 2026 (Argaam) is one of the few public, dated signals of softening in institutional Saudi property.
Implied rent: where a fund discloses both annual rent and area, divide, as with Elite Mall's SAR 730/sqm above. Treat income momentum with care: AlAhli REIT 1's rental income rose 29% year-on-year to about SAR 59.7 million in Q1 2026 (Argaam), Alinma Retail REIT's 52% to roughly SAR 38.4 million (Argaam); growth that steep is mostly acquisitions, not like-for-like rent inflation.
Where the proxy flatters the market
Read honestly, REIT disclosures are a precise picture of a biased sample, and the bias runs one way: upward. The 91.2% average of Q1 2026 is not a national occupancy rate. It is a composition-weighted average of what professional managers chose to own; treating it as "the Saudi market" overstates the health of everything the funds refused to buy.
The CMA's 75% developed-income-asset floor filters out land, development risk and broken buildings, and managers then select further for credit tenants and long leases. The spread shows in the filings: Riyad REIT's government-let towers sit at 100% while SEDCO Capital REIT's multi-tenant Al Khalidiya Business Center in Jeddah ran at 74% (SEDCO Capital REIT Annual Report 2024, Dec 2024), and Musharaka's Al-Khobar hospitality and residential assets both printed 51% (Musharaka REIT, FY2024).
Three numbers stay hidden even here. No consolidated REIT-sector market capitalisation or NAV exists anywhere public; the only clean route is summing fund-level disclosures (Riyad REIT alone is SAR 2.72 billion as of Dec 2025 (annual report)). Hotel average daily rate is nowhere: filings publish lease income, not room revenue. And no filing aggregates to a city-wide vacancy rate; only private brokerage surveys claim that number; we do not use them.
Omran estimate (derived, not disclosed). Musharaka REIT's Radisson Blu Hotel Apartments earned SAR 9,145,958 across 92 units in FY2024 (annual report): 9,145,958 ÷ 92 ≈ SAR 99,400 of fund income per unit per year at 51% occupancy. This is fund income per key, not an average daily rate: room pricing is not published.
We maintain the full asset-level extraction across all 20 funds, every figure dated and sourced. Request the underlying REIT dataset, or scope a briefing against your own asset list.
FAQ
How many REITs are listed on Tadawul? Twenty in total as of July 2026: 19 funds on the main market under tickers 4330 to 4350, plus Alwaha REIT on Nomu (Argaam).
What disclosure requirements do Saudi REITs have? Quarterly statements within 10 days, a semi-annual per-property occupancy list, dual independent valuations every six months, and immediate disclosure of deals worth 10% or more of NAV, under the regulations of 24 Nov 2025 (CMA).
What is the Saudi REIT occupancy rate? Sector average occupancy was 91.2% in Q1 2026, down from 92.1% in Q1 2025 (Argaam survey). Funds range from Riyad REIT's 98% (Dec 2025) to 51% on single Musharaka assets in Al-Khobar; the average skews institutional, not a whole-market vacancy read.
What is the Saudi REIT dividend yield? REITs must distribute at least 90% of net profits annually, quoted against the SAR 10 nominal unit value, not market price: Alinma Hospitality REIT paid 3.2% for H1 2026, AlAhli REIT 1 rose from 2% (H1 2025) to 2.2% (H2 2025), Riyad REIT paid 1.6% for H2 2025 (Argaam dividend records). Sector-wide, listed REITs paid nearly SAR 464 million in H1 2024 (Argaam).
Sources
- Capital Market Authority, Real Estate Investment Funds Regulations (24 Nov 2025; disclosure, valuation, distribution rules): link
- Argaam, Tadawul TASI REIT sector listing (19 main-market funds): link
- Argaam, Nomu listing (Alwaha REIT): link
- Riyad REIT Fund, Annual Report 2025 (occupancy, NLA, fund size, Olaya Tower, Al-Raed): link
- Al Rajhi REIT Fund, Annual Report 2023 (Al Ahsa Square): link
- Mulkia Gulf Real Estate REIT, Annual Report 2024 (Elite Mall rent, area, valuation): link
- Musharaka REIT Fund, Annual Report 2024 (Al Orouba, Radisson Blu, Al Barakah): link
- Jadwa REIT Alharamain, portfolio disclosures (Makkah hotel acquisitions): link
- SEDCO Capital REIT, Annual Report 2024 (Al Khalidiya 74%): link
- Argaam, Saudi REIT occupancy survey Q1 2026 (91.2%): link
- Argaam, Riyad REIT occupancy Q1 2024 (94.1%): link
- Argaam, AlAhli REIT 1 rental income Q1 2026: link
- Argaam, Alinma Retail REIT rental income Q1 2026: link
- Argaam, sector cash dividends H1 2024 (SAR 464m): link
- Argaam dividend records (Alinma Hospitality 3.2% H1 2026; AlAhli 2%/2.2%; Riyad REIT 1.6%): link, link, link, link