Saudi hotel occupancy slips to 60.8% as most regions improve
Saudi hotels were 60.8% full in Q1 2026, down 2.1 points on a year earlier, even though seven of thirteen regions improved. City-by-city figures from GASTAT.
Saudi hotels were 60.8% full in the first quarter of 2026, down from 63.0% a year earlier. That is the national figure GASTAT released on 2 July 2026. Serviced apartments moved the other way, up 1.0 point to 51.6%.
Behind that average, Al-Madinah city hotels were 84.0% full and Riyadh's 51.0%. It is also the first quarter GASTAT has published figures city by city.
Key figures at a glance
| Metric | Value | Scope | As of | Source |
|---|---|---|---|---|
| National hotel occupancy | 60.8%, down 2.1pp year on year | Kingdom, licensed hotels | Q1 2026 | GASTAT Table 1.2 |
| Serviced apartments and others | 51.6%, up 1.0pp | Kingdom, licensed | Q1 2026 | GASTAT bulletin |
| Highest city rate, Al-Madinah | 84.0% | City, hotels | Q1 2026 | GASTAT Table 2.8 |
| Riyadh city, including Diriyah | 51.0% | City, hotels | Q1 2026 | GASTAT Table 2.8 |
| National hotel ADR | SAR 423, down 11.4%, ex-VAT and municipal fees | Kingdom, licensed hotels | Q1 2026 | GASTAT Table 1.3 |
| Licensed hospitality facilities | 6,122, up 22.7% year on year | Kingdom | Q1 2026 | GASTAT bulletin |
| Licensed rooms | 615,862 in all, 506,005 of them in hotels | Kingdom | Q1 2026 | GASTAT Table 2.2 |
| Hotels-only RevPAR | SAR 320 | Kingdom, hotels | H1 2025 | Ministry of Tourism, p.12 |
Why the national rate fell while most regions rose
Seven of the thirteen regions saw hotel occupancy rise between Q1 2025 and Q1 2026, and six saw it fall (GASTAT Table 2.22). The national rate still lost 2.1 points, because it is weighted by rooms. The Makkah region holds 365,503 of the Kingdom's 506,005 licensed hotel rooms, and with Al-Madinah region's 71,742 the two pilgrimage regions hold 86.4% of national hotel room stock (Tables 2.2 and 2.22 of the Q1 2026 workbook).
Weighting the regional rates by room count, we get 60.78%, close to the 60.84% GASTAT prints. With every region weighted equally the answer would be 44.4%.
Ar Riyadh had the biggest weight among the fallers, down 8.9 points from 59.5% to 50.6%. Tabuk fell further, by 13.1 points, while Northern Borders led the risers at plus 5.4. So the national average says more about Makkah than about Riyadh.
Hotel occupancy by city
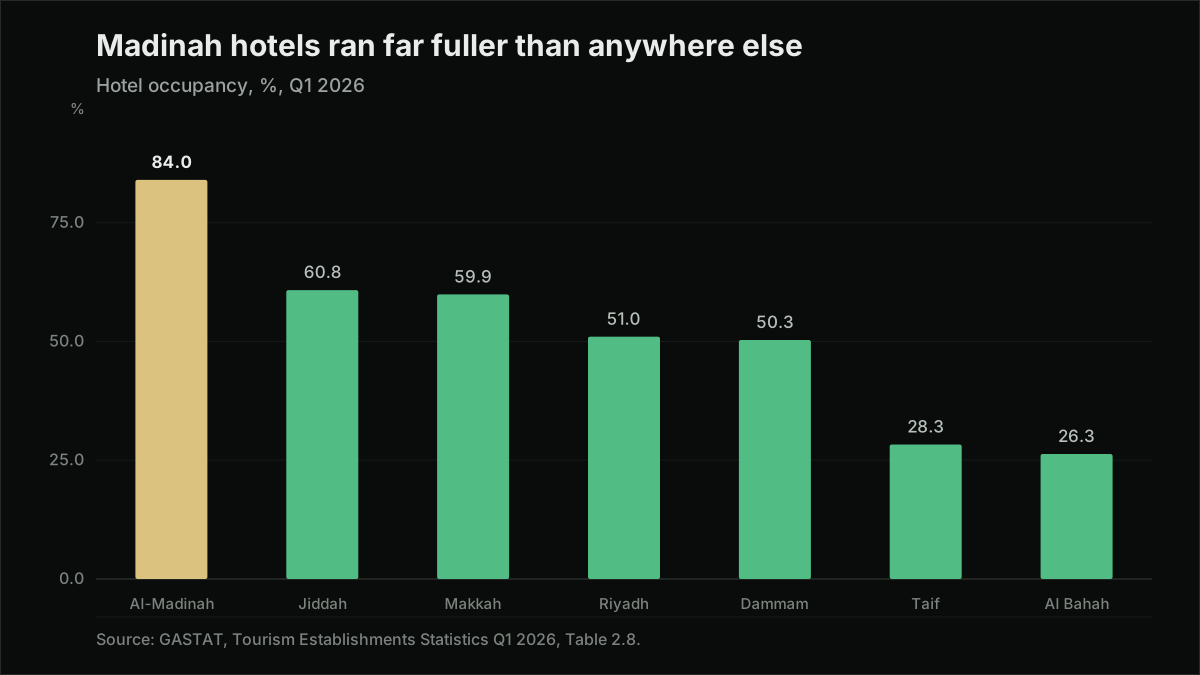
We opened the Q2, Q3 and Q4 2025 workbooks and none has a city table, so this series is one quarter long. Occupancy is Table 2.8, rate Table 2.11, length of stay Table 2.20.
| City or governorate, as GASTAT labels it | Hotel occupancy | Hotel ADR (SAR, ex-VAT) | Average stay (nights) |
|---|---|---|---|
| Al-Madinah city | 84.0% | 471 | 3.49 |
| Jiddah governorate | 60.8% | 473 | 2.23 |
| Makkah city | 59.9% | 356 | 5.62 |
| Al-Ahsa governorate | 55.6% | 610 | 1.70 |
| Riyadh city, incl. Diriyah | 51.0% | 783 | 2.47 |
| Dammam metropolitan area | 50.3% | 471 | 2.23 |
| Buraydah and Unayzah | 49.4% | 465 | 1.79 |
| Arar | 47.5% | 251 | 1.68 |
| Jazan | 43.5% | 329 | 1.88 |
| Najran | 42.4% | 405 | 2.45 |
| Hail | 40.0% | 444 | 1.74 |
| Sakaka | 38.7% | 276 | 1.98 |
| Taif governorate | 28.3% | 390 | 1.69 |
| Tabuk | 27.3% | 293 | 2.20 |
| Abha and Khamis Mushayt | 27.3% | 268 | 1.71 |
| Al Bahah | 26.3% | 286 | 1.61 |
| Other (GASTAT residual, not a place) | 36.6% | 618 | 1.99 |
All values Q1 2026, from the Q1 2026 workbook. Riyadh includes Diriyah, and Dammam is the metropolitan area with Khobar and Dhahran. Jiddah, Al-Ahsa and Taif are governorates. "Other" is GASTAT's catch-all for everywhere it does not name, so it should not be ranked against real markets.
Makkah kept its rooms full by cutting rates
Makkah region occupancy fell only 1.5 points, from 61.0% to 59.5%, but its average daily rate fell 17.4%, the largest drop of any region (GASTAT Table 2.24).
Much of the new supply went there. Makkah province took 77% of the new hotel keys licensed in H1 2025, or 44,637 rooms (Ministry of Tourism, pp.21-22 and p.26). The periods differ, since licensing covers H1 2025 and the occupancy change compares Q1 2026 with Q1 2025. Still, a region taking three in four new keys while holding occupancy within a point and a half of last year is filling them on price.
Outside Hajj, Makkah city's rate of SAR 356 is below Jiddah at SAR 473 and Dammam at SAR 471. With 72.2% of licensed hotel rooms in the Makkah region, the national 11.4% fall in room rates largely reflects Makkah.
Makkah hotels are also bigger, at about 219 rooms on average against 114 in the Riyadh region (Table 2.2 divided by Table 2.1), and guests stay 5.62 nights in Makkah city against 2.47 in Riyadh (Table 2.20). Anyone valuing a Makkah hotel should look at rate before occupancy, and the Riyadh hotel market needs its own comparables.
Riyadh empties out in March
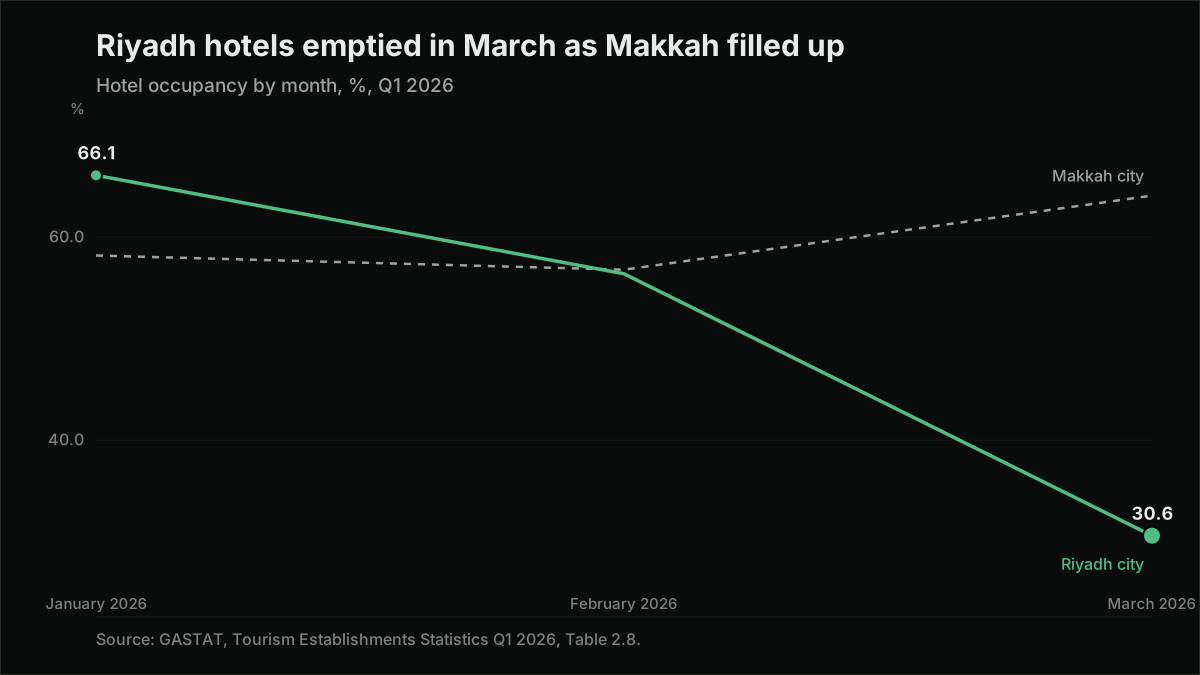
Riyadh city hotels went from 66.1% full in January 2026 to 30.6% in March, while Makkah city rose to 64.1% and Al-Madinah stayed above 81% every month (Table 2.8). The Kingdom figure moved by about four points across the quarter (Table 2.27).
The Q1 2025 workbook shows the same pattern at region level a year earlier, with Ar Riyadh dropping from 73.7% in February to 36.3% in March as the Makkah region rose to 65.8%. The Hijri calendar moves the pilgrimage season earlier each Gregorian year, and business travel drains from Riyadh in the weeks Umrah fills the holy cities. In 2025 the drop came in March. In 2026 it had already started in February.
Riyadh's quarterly 51.0% therefore hides a month at 30.6%, and a debt-service test built on the average can pass for a quarter in which the hotel emptied. In the Ministry of Tourism's H1 2025 report, the latest we have read, Riyadh including Diriyah recorded RevPAR of SAR 450, down 23.2%, the steepest fall of any major market (p.12).
The number of licensed hotels keeps growing
GASTAT only counts facilities with an active Ministry of Tourism licence, and that base has more than doubled, from 2,802 licensed facilities in Q1 2024 to 6,122 in Q1 2026. Hotels alone went from 1,441 to 2,963 (Table 1.1). Every year-on-year comparison is between two different sets of hotels.
Licensed hotel rooms rose from 450,074 in Q2 2025 to 506,005 in Q1 2026, up 12.4% over three quarters (Q2 2025, Q3 2025, Q4 2025 and Q1 2026 workbooks, Table 2.2). Neither GASTAT nor the Ministry says whether that is new hotels opening or a licensing backlog clearing, so a hotel that traded without a licence can show up as new supply the day its paperwork clears (see Saudi hotel room supply).
What the official data leaves out
- Occupancy by grade or brand. Not published, so there is no reliable Saudi "upper upscale" figure.
- Unlicensed and short-let rooms. Outside the count, and nobody sizes them.
- Rooms under construction. Not counted. The nearest proxy is the 76,350 keys newly licensed in H1 2025 (Ministry of Tourism, p.22).
- Quarterly RevPAR. GASTAT does not publish it. The Ministry does, but its full-year 2025 report (April 2026) is not reachable from here.
Omran estimate: hotel RevPAR. Multiplying GASTAT's occupancy by its room rate gives national hotel RevPAR of about SAR 257 in Q1 2026, against about SAR 301 a year earlier, a fall of about 14%. The same method reproduces the Ministry's SAR 320 for H1 2025 within a riyal (p.12). Riyadh including Diriyah comes out at about SAR 399 and Al-Madinah city at about SAR 396. One runs at 51.0% and SAR 783, the other at 84.0% and SAR 471, and they earn almost the same per available room. See RevPAR.
We keep these figures at full precision alongside the Saudi hotel ADR series. Ask for the city table for the market you are pricing.
FAQ
What is the hotel occupancy rate in Saudi Arabia? 60.8% for licensed hotels in Q1 2026, which means January to March 2026, published by GASTAT on 2 July 2026 and down 2.1 points from 63.0% a year earlier. Serviced apartments and other licensed facilities ran at 51.6% in the same quarter. GASTAT releases this product about three months after quarter end (Q3 2025 on 8 January 2026, Q4 2025 on 9 April 2026, Q1 2026 on 2 July 2026), which puts the Q2 2026 print in the first ten days of October 2026.
Which Saudi city has the highest hotel occupancy, and which the lowest? Al-Madinah city at 84.0% and Al Bahah at 26.3%, both Q1 2026, GASTAT Table 2.8. Makkah city sits at 59.9%, just below Jiddah governorate's 60.8%, so Makkah is not the Kingdom's highest-occupancy pilgrimage market.
Does GASTAT cover all hotels? Only licensed ones, so unlicensed and short-let rooms are left out.
Can I compare these figures with a private benchmarking service? Only after four adjustments. Three come from GASTAT: length of stay divides room nights by guests rather than by bookings and the universe is licensed facilities only, both in the methodology report. The ADR also excludes VAT and municipal service fees. That is stated only in a note under Table 1.3 of the workbook, not in the report. The fourth is ours: a quarterly rate is not the average of three monthly rates.
Sources
- GASTAT, Tourism Establishments Statistics Q1 2026 workbook (occupancy, ADR, stay, rooms, city tables 2.8, 2.11, 2.20, regional change tables 2.22 and 2.24): link
- GASTAT, Tourism Establishments Statistics Q1 2026 bulletin (60.8%, 51.6%, SAR 423, 6,122 facilities): link
- GASTAT, Tourism Establishments Statistics Q1 2025 workbook (regional monthly 2025, no city table): link
- GASTAT, Tourism Establishments Statistics Q2 2025 workbook (450,074 hotel rooms, 544,879 rooms in all): link
- GASTAT, Tourism Establishments Statistics Q3 2025 workbook (464,672 hotel rooms, revision test): link
- GASTAT, Tourism Establishments Statistics Q4 2025 workbook (491,652 hotel rooms, no city table): link
- GASTAT, Tourism Establishments Statistics Q4 2025 bulletin (57.3%, released 9 April 2026): link
- GASTAT, Methodology and Quality Report for Tourism Establishments Statistics V-4.1 (definitions, register basis, no microdata): link
- GASTAT English news feed (release cadence; Q3 2025 item dated 8 January 2026): link
- Ministry of Tourism, Hospitality Sector Performance H1 2025 (RevPAR, city KPIs, newly licensed keys, room-key stock): link
- Arab News, dating the GASTAT Q1 2026 release to 5 July 2026 (every figure read in the workbook first): link
- Al-Madina, 18 April 2026, that a full-year 2025 hospitality report was issued by the Ministry of Tourism: link