Saudi mall occupancy: the biggest owner's 91.2% leaves out its weakest malls
There is no official Saudi mall occupancy rate. The largest listed owner reported 91.2% at 30 June 2026, and 89.5% across every mall it runs.
No ministry publishes a Saudi mall occupancy rate. Three owners listed on Tadawul do, and all three reported one at 30 June 2026. The largest, Cenomi Centers, put its like-for-like occupancy at 91.2%, its weakest reading since September 2023 (Cenomi Centers, H1-2026).
Six months earlier the same company printed two figures on one page. Its like-for-like basket was 94.2% full on 31 December 2025. Everything it operates was 89.5% full, with individual malls ranging from 42.4% to 99.4% (FY-2025 deck, p.31). Most reports quote the first.
Key figures at a glance
| Metric | Value | Scope | As of | Source |
|---|---|---|---|---|
| Like-for-like occupancy, largest owner | 91.2% | fixed basket, not the full 20-asset portfolio | 30 Jun 2026 | Cenomi H1-26 |
| Whole-portfolio occupancy, same owner | 89.5% on 1,294,413 sqm | every asset operated | 31 Dec 2025 | Cenomi FY-25 |
| Second listed landlord, per asset | 99.5% / 100% / 86% / 94% | 4 malls, 3 cities | 30 Jun 2026 | Alandalus |
| Retail REIT, two remaining malls | 84%, 57% | Dawadmi, Hafr Al Batin | 30 Jun 2026 | Alinma REIT |
| Floorspace with a published occupancy | 1,577,530 sqm, 27 assets | KSA, disclosed only | Mar to Jun 2026 | Omran sum |
| National occupancy, GLA, market share | not published | KSA | n/a | n/a |
Who publishes a Saudi mall occupancy rate
Three listed owners, covering 29 assets: 20 malls in nine cities from Cenomi, seven retail assets from Alandalus Property and two malls in a retail REIT. All of it sits in Tadawul filings.
Alandalus Property (Tadawul 4320) reported Alandalus Mall Jeddah at 99.5%, Hayat Mall Riyadh at 100%, The Village Mall Jeddah at 86% and Dareen Mall Dammam at 94% at 30 June 2026 (Alandalus). Alinma Retail REIT reported Dawadmi at 84% and Hafr Al Batin at 57% on the same date (Alinma). Its 2025 annual report puts the Hafr Al Batin figure down to the exit of key tenants.
Private owners disclose nothing. Al Othaim Investment, Kinan and Hamat Holding run malls in the same cities, and Hamat operates two of the four Alandalus malls. Al Ahli REIT Fund 1, which holds Alandalus Mall, blocked our requests with an HTTP 403, so we could not check it. This is the largest published record we could open. It leans towards listed stock, the fullest end of the Saudi retail market.
Why one deck shows two numbers 4.7 points apart
The 94.2% at 31 December 2025 is like-for-like. That means a fixed basket that leaves out malls being opened, sold or handed back. The 89.5% on the same date covers everything the company operates.
The appendix prints three rows side by side:
| Basket | Occupancy |
|---|---|
| Like-for-like | 94.2% |
| Consolidated | 90.7% |
| Total | 89.5% |
Our check on the published table. We trust the like-for-like row least because of what happens when we weight the nineteen malls in the like-for-like table by the floorspace printed beside each one: the basket comes out at 91.3%, against the printed 94.2%. The floorspace total includes the Mall of Dhahran extension, but the 94.2% only works if that mall is left out. The top and bottom of the ratio come from different baskets. Derived from the FY-2025 appendix, p.31.
A whole-portfolio figure for 31 March 2026 also reads 89.5%. But its own components give 90.7%, and 89.5% is exactly the previous quarter's number (Q1-2026, p.30). So we use December 2025 as the latest whole-portfolio figure that adds up.
Mall of Dhahran is the mall left out. It was 98.4% let in December 2024 (FY-2024 deck, p.37) and slid through 2025 (Q1, Q3, Q4). By March 2026 it was gone from the table.
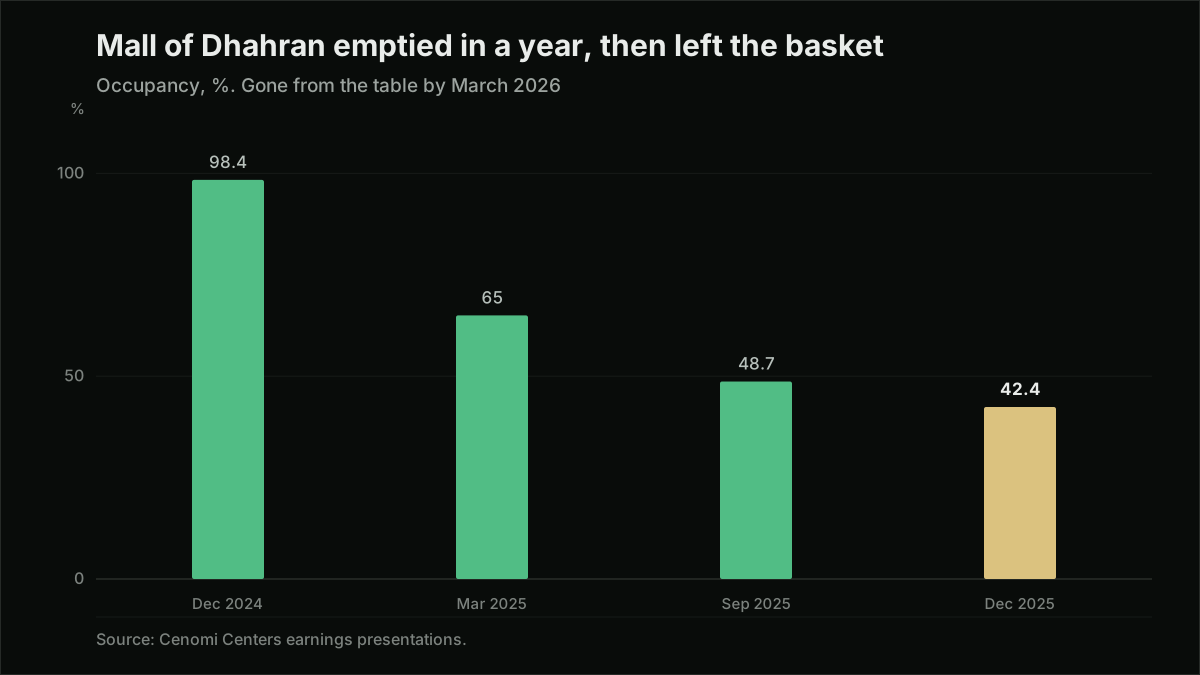
Twelve of the malls in that table stood on land the company did not own at the prospectus date of October 2025, so occupancy should be read next to the lease column (prospectus, Table 3.9).
Seven years of figures that do not form one series
The record starts at 93.4% across 19 malls for the year to 31 March 2019 (FY2020 release). The next two annual figures come from the FY2021 and FY2022 releases.
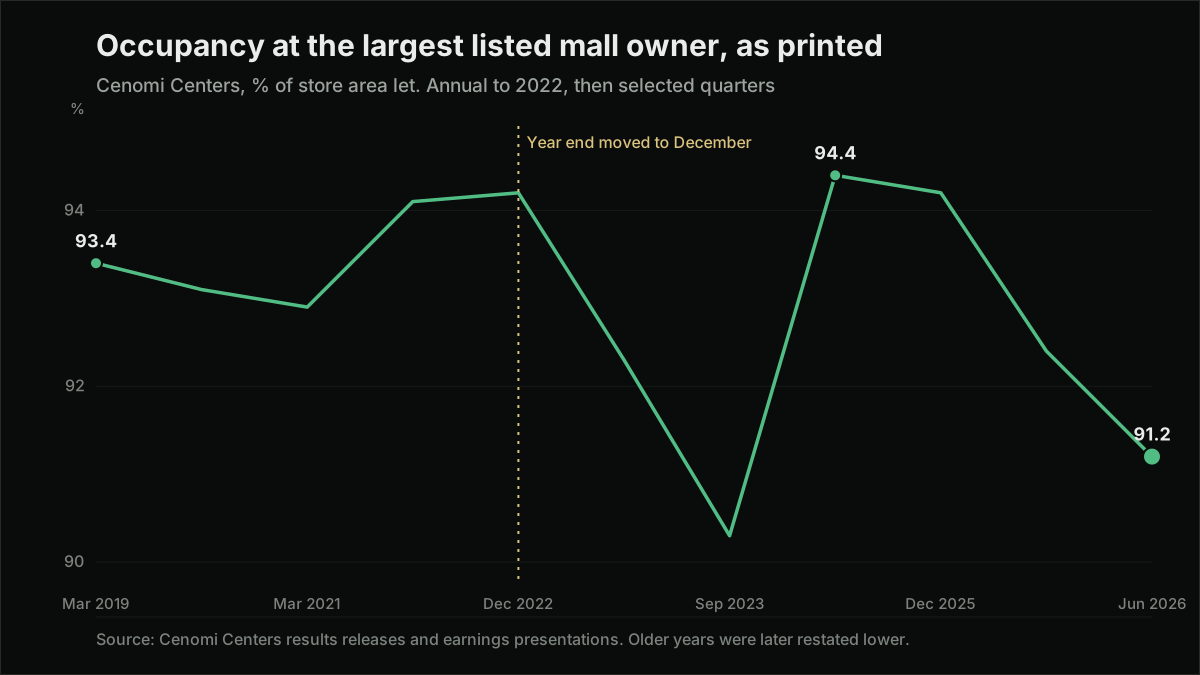
Two breaks stop these joining up with later figures. First, the year end moved in December 2022, leaving a nine-month stub at 94.2% (short-year results). Second, the 2025 sukuk prospectus restates the old figures at 92.1% (31 March 2021) and 92.4% (31 March 2022), where the releases at the time said 92.9% and 94.1% (prospectus, CMA). So anyone saying Saudi mall occupancy peaked at 94.1% in FY2022 is quoting a figure the company has since revised.
Taken as printed, the quarterly line bottoms at 90.3% in September 2023 and stands at 91.2% now. Category A malls still held 94.9% at 30 June 2026 (Q2-26 release).
What the lease tables show
Occupancy counts floorspace, not rent. At 31 December 2024, anchors above 2,000 sqm took 37.5% of classified occupied space at SAR 648 per sqm a year. Line stores under 500 sqm paid SAR 2,957 (prospectus, Table 3.8). Let 1,000 sqm to an anchor or to line stores and occupancy is identical, but the rent differs 4.6 times.
Our calculation from the prospectus tables. We divided FY2024 net rental revenue by each mall's occupied floorspace. Nakheel Plaza Qassim was 99.0% occupied and earned SAR 1,081 per occupied sqm. Aziz Mall was 91.4% occupied and earned SAR 1,539, 42% more with less space let. Derived from the sukuk base prospectus.
How much mall space is covered
No Saudi authority publishes a national mall occupancy rate, total mall floorspace or a count of shopping centres. The only market share in circulation comes from the issuer itself, citing an unnamed third-party study.
Our estimate for the mall space that reports occupancy. We weighted each disclosed asset by its own published area, using the 20-asset table at 31 March 2026, the four Alandalus malls at 30 June 2026 and three strip centres. That gives 91.7% on 1,577,530 sqm. The owners measure differently: one footnotes occupancy on store area only, the other gives no basis. Nobody publishes a national total to compare it with. Derived from the Q1-2026 appendix and the Alandalus Q2 2026 deck.
What the 2026 guidance implies
Cenomi guides GLA to 1.57 million sqm by December 2026, up from 1.25 million at June 2026. The growth comes from Westfield Jeddah (104,000 sqm, operational 30 July 2026) and Westfield Riyadh (220,000 sqm, targeted Q4 2026). Occupancy is guided at 94.0% (H1-2026, slide 13; Q2-2026 release).
Our arithmetic on that guidance. Assume the existing space returns to its December 2025 peak of 94.2%. For the enlarged portfolio to reach 94.0%, the new space must open about 93% let, well above the 70% to 75% first-year average the company reports for its own openings. The 94.0% guidance is for the like-for-like basket. The floorspace guidance covers every mall, new ones included. Occupancy across all operated space will fall in 2026 even if every existing mall improves. Derived from slide 13 of the H1-2026 presentation and the Q2-2026 release.
No one publishes tenant sales or occupancy cost ratios, so card spending is the nearest demand series. Apparel took SAR 1.265 billion of the SAR 14.17 billion spent through Saudi terminals in the week to 22 August 2026, with the food and beverage category next to it and no mall-specific line (SAMA). No one publishes how long space stays empty either, which is what separates a mall rotating tenants from one losing them. Ask for the underlying mall table, per asset and per date, with the basket and basis on every cell.
FAQ
What is the occupancy rate of Saudi malls? There is no national figure. The largest listed owner reported 91.2% like-for-like at 30 June 2026 and 94.2% at 31 December 2025. Across everything it operates, the December figure was 89.5%. A second listed landlord reported 95% across its three super-regional malls at 30 June 2026. A retail REIT reported 84% and 57% at its two remaining malls on that date.
Why does one presentation show two occupancy numbers? One is like-for-like and one is not. The like-for-like basket leaves out assets being opened, sold or handed back. At 31 December 2025, that meant leaving out a mall at 42.4% on an expiring head lease. The gap was 4.7 percentage points, against 3.8 a year earlier.
Does every Saudi owner measure mall occupancy the same way? No. Cenomi Centers measures on store area only, excluding kiosks and warehouses. Alandalus gives one percentage per asset with no basis note. Its Q2 2026 deck shows Dareen Mall at 94% on the asset page and 92% in the summary row above.
Do new Saudi malls open full? No. Every mall the owner has opened since 2017 averaged 70% to 75% occupancy in its first year. U Walk Jeddah soft-opened at roughly 30% in December 2023. It reached 70.6% of GLA by end-2025, or 80.5% on the store-area basis used in the presentation.
Sources
- Cenomi Centers, H1-2026 earnings presentation (91.2% at 30 Jun 2026, quarterly series, GLA guidance, expiry profile): link
- Cenomi Centers, Q2-2026 press release, 5 Aug 2026 (Category A 94.9%, Westfield status and pre-leasing definition): link
- Cenomi Centers, FY-2025 earnings presentation (31 Dec 2025 appendix, per-mall table, SAR 2,114 per sqm): link
- Cenomi Centers, Q1-2026 earnings presentation (31 Mar 2026 appendix, restated renewal count, Dhahran removal): link
- Cenomi Centers, 9M-2025 earnings presentation (30 Sep 2025 appendix, Mall of Dhahran at 48.7%): link
- Cenomi Centers, Q1-2025 earnings presentation (31 Mar 2025 appendix, Mall of Dhahran at 65.0%, 751 renewals over 150,000 sqm): link
- Cenomi Centers, FY-2024 earnings presentation (31 Dec 2024 appendix, Mall of Dhahran 132,237 sqm at 98.4%, U Walk Jeddah 68.8%): link
- Cenomi Centers, Annual Report 2025 (20 assets in nine cities, U Walk Jeddah at 70.6% of GLA): link
- Arabian Centres Company, sukuk base prospectus, Oct 2025, CMA-hosted (restated back-series, per-mall occupancy, footfall and net rental revenue, lease expiry, store bands, head-lease dates, first-year occupancy): link
- Arabian Centres, results for the year ended 31 March 2020 (FY2019 93.4%, FY2020 93.1%): link
- Arabian Centres, results for the year ended 31 March 2021 (FY2021 92.9%): link
- Arabian Centres, results for the year ended 31 March 2022 (FY2022 94.1%): link
- Cenomi Centers, results for the nine months ended 31 December 2022 (year-end change, 94.2%): link
- Alandalus Property, Q2 2026 investor presentation (per-asset occupancy at 30 Jun 2026, GLA against built area, segment rows): link
- Alinma Retail REIT, Annual Report 2025 (Dawadmi 84%, Hafr Al Batin 57%, contracts not on Ejar): link
- Alinma Retail REIT, Q2 2026 quarterly statement (asset list and occupancy at 30 Jun 2026): link
- REGA, Riyadh rent provisions effective 25 September 2025 (five-year freeze, automatic renewal, renewal refusal): link
- SAMA, Weekly Points of Sale Transactions report, week to 22 August 2026 (SAR 14.17bn total, apparel SAR 1.265bn): link